Medway Council Election
4 May 2000
Results Map
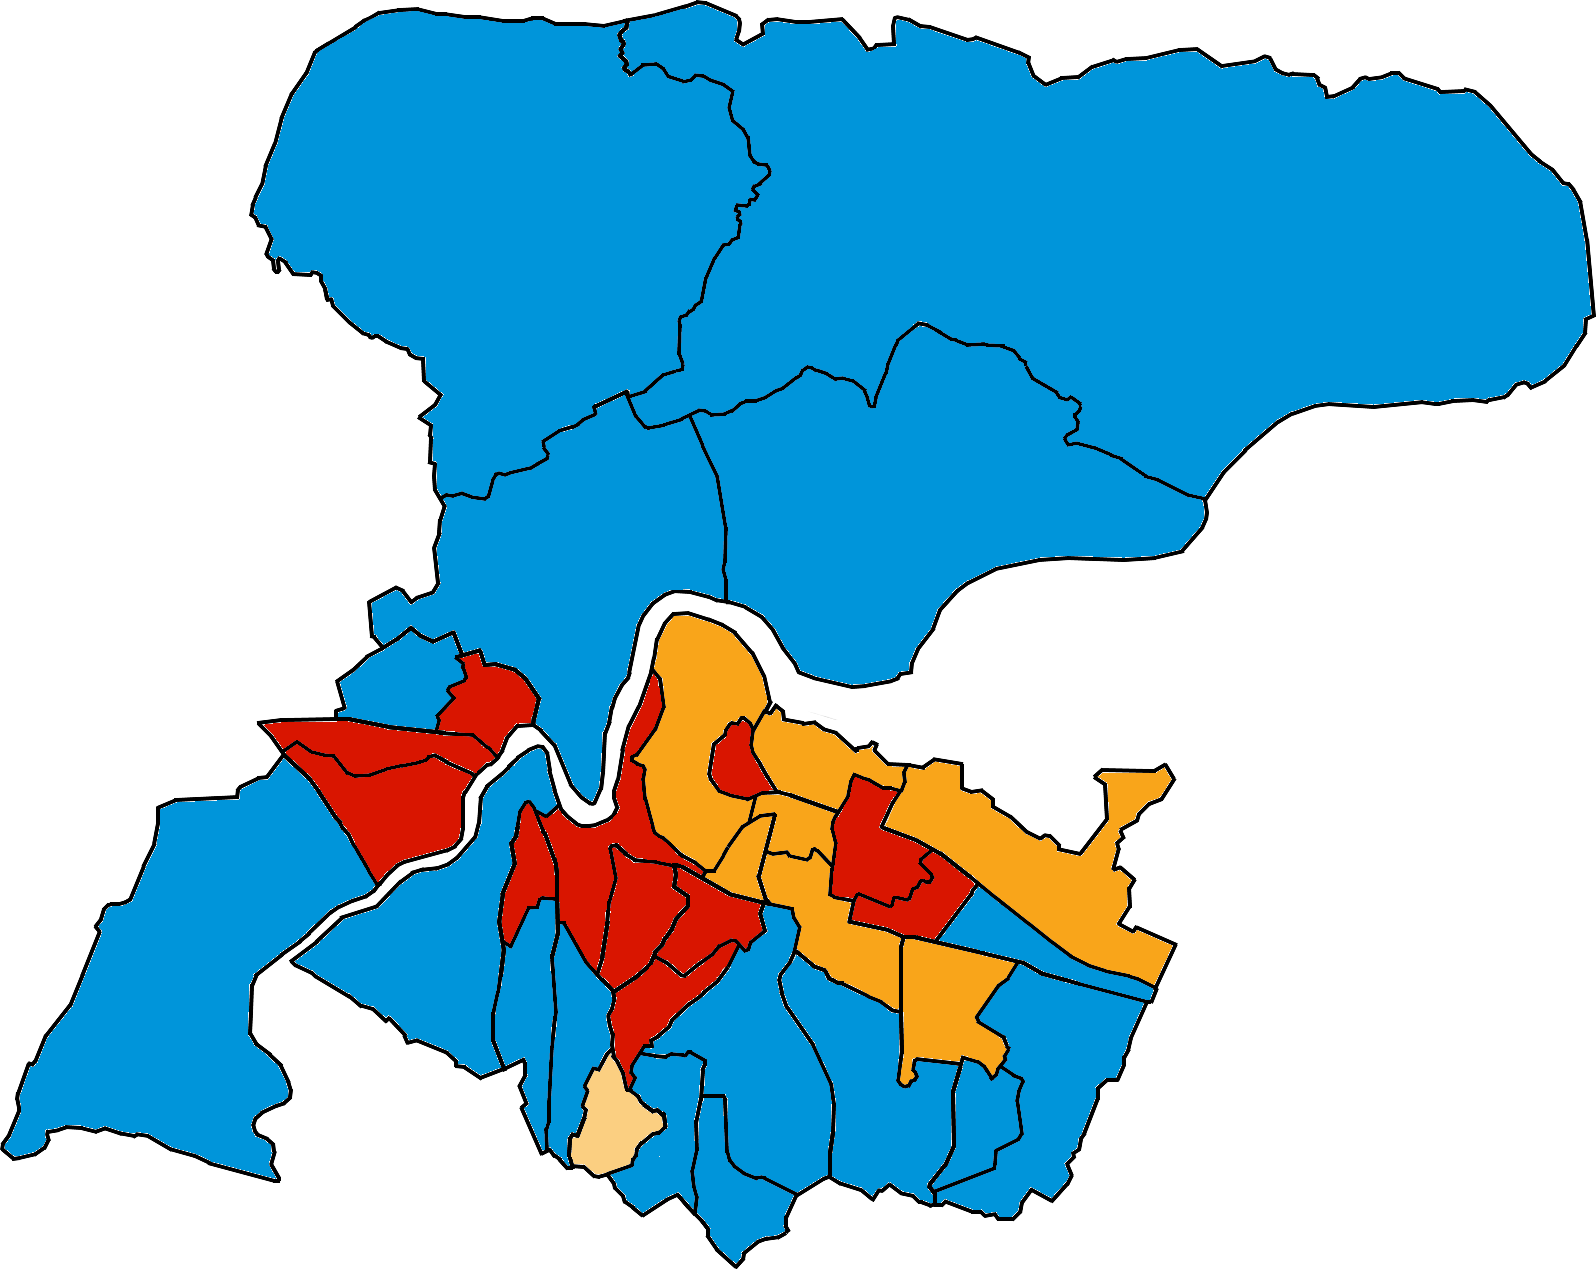
Colour denotes the highest-polling candidate in each ward. If a candidate from a different party was also elected in the same ward, they are denoted by a star.
Summary of Results
| Party | Seats | Gains | Losses | Net | Vote | Change | |
| Conservative | 38 | 21 | 3 | +18 | 43.6% | +9.6 | |
| Labour | 25 | 1 | 15 | -14 | 33.6% | -5.7 | |
| Liberal Democrats | 15 | 3 | 9 | -6 | 18.1% | -8.1 | |
| Independent Liberal Democrat | 2 | 2 | - | +2 | 1.7% | +1.7 | |
| Independent | - | - | - | - | 2.3% | +1.9 | |
| Ukip | - | - | - | - | 0.4% | +0.3 | |
| English First | - | - | - | - | 0.2% | +0.2 | |
| National Front | - | - | - | - | 0.1% | +0.1 |
Click on the name of a party to view only that party's candidates.
Results by Ward
To view the full results for each ward, please click on the ward name above.
Composition of the Council
Vote Change
Swing
| Previous election | Next election |
| « 1 May 1997 | 1 May 2003 » |
Did you know? Medway Elects is an independent project with minimal advertising income and no super-rich donors. If you have found our service useful, please consider supporting us with a regular monthly donation on Patreon or buy us a coffee to help support our ongoing running costs!