Medway Council Election
1 May 1997
Results Map
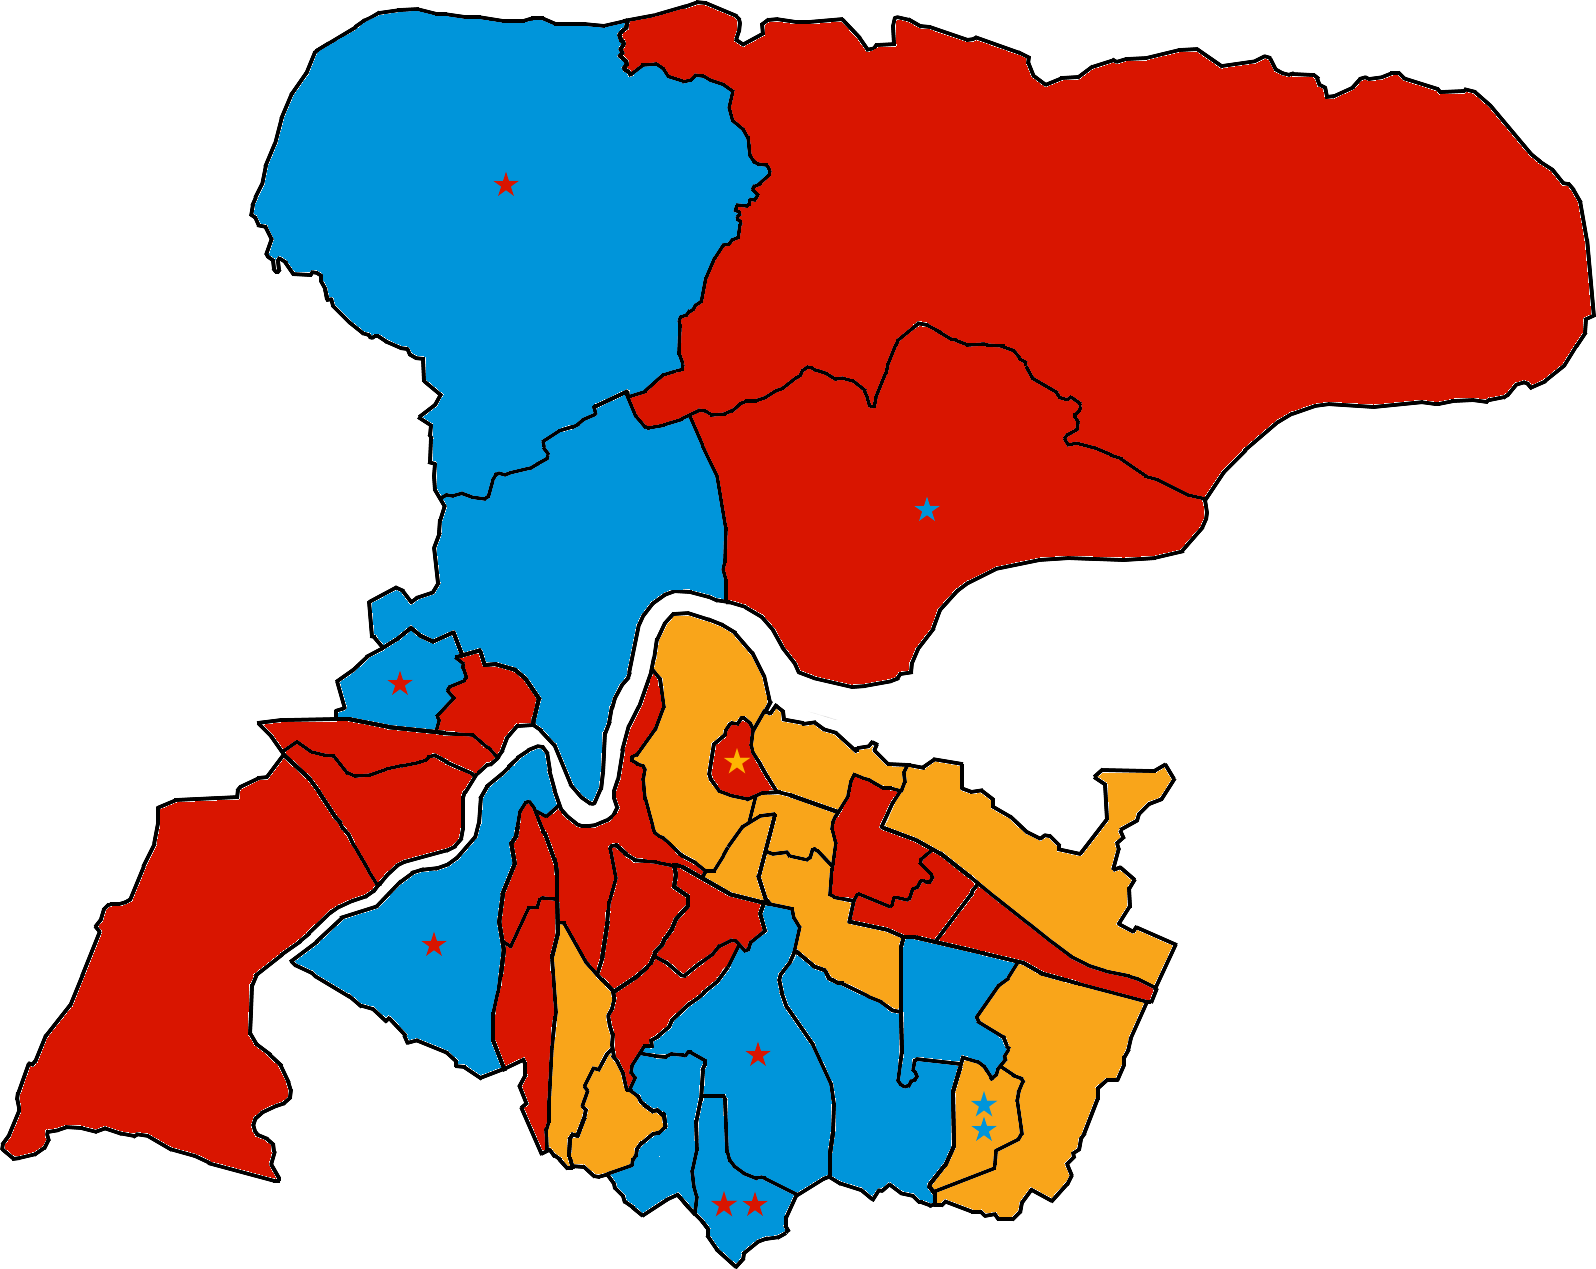
Colour denotes the highest-polling candidate in each ward. If a candidate from a different party was also elected in the same ward, they are denoted by a star.
Summary of Results
| Party | Seats | Vote | |
| Labour | 39 | 39.3% | |
| Liberal Democrats | 21 | 26.2% | |
| Conservative | 20 | 34.0% | |
| Independent | - | 0.4% | |
| Ukip | - | 0.1% |
Click on the name of a party to view only that party's candidates.
Results by Ward
To view the full results for each ward, please click on the ward name above.
Composition of the Council
| Next election |
| 4 May 2000 » |
Did you know? Medway Elects is an independent project with minimal advertising income and no super-rich donors. If you have found our service useful, please consider supporting us with a regular monthly donation on Patreon or buy us a coffee to help support our ongoing running costs!