2 May 2019
Results Map
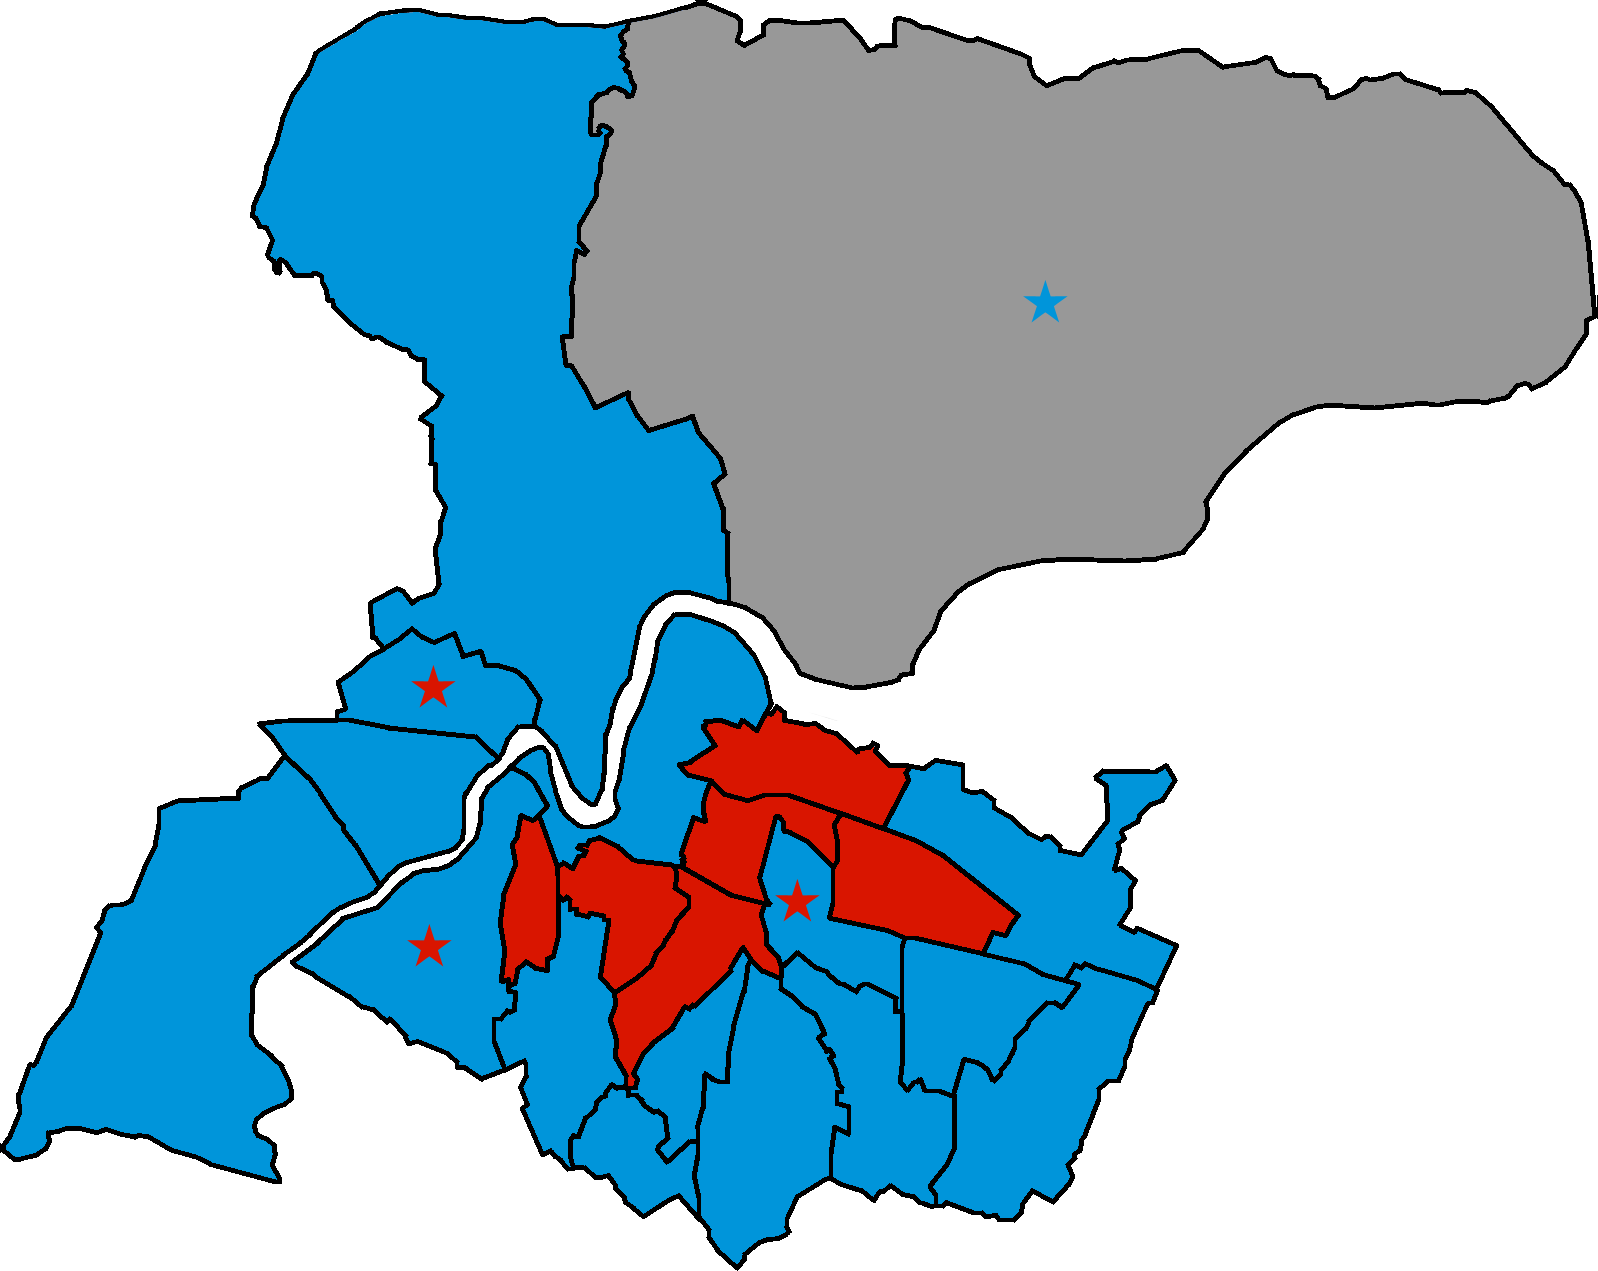
Colour denotes the highest-polling candidate in each ward. If a candidate from a different party was also elected in the same ward, they are denoted by a star.
Summary of Results
Party | Seats | Gains | Losses | Net | Vote | Change | |
Conservative | 33 | 1 | 4 | -3 | 34.4% | -5.9 | |
Labour | 20 | 4 | - | +4 | 26.8% | +2.3 | |
Independent | 2 | 2 | - | +2 | 8.7% | +7.7 | |
Ukip | - | - | 3 | -3 | 16.5% | -6.3 | |
Green party | - | - | - | - | 7.8% | +2.7 | |
Liberal Democrats | - | - | - | - | 4.9% | +1.3 | |
Christian Peoples Alliance | - | - | - | - | 0.5% | +0.5 | |
Animal Welfare party | - | - | - | - | 0.3% | +0.3 | |
Turnout | 61,812 | 31.3% |
Click on the name of a party to view only that party's candidates.
Results by Ward
Gillingham North | |
Labour and Co-operative hold | |
Labour and Co-operative hold |
Results by
Chatham Central | |||||
Vince Maple * Labour |
1,577 | 49.1% | |||
Harinder Singh Mahil Labour |
1,343 | ||||
Siju Adeoye Labour |
1,258 | ||||
Nicole Bushill Ukip |
520 | 16.2% | |||
David Peter Jarrett Conservative |
508 | 15.8% | |||
Pat Gulvin Conservative |
503 | ||||
Peter Ronald Jenkins Independent |
439 | 13.7% | |||
Denise Kay Wildey Conservative |
435 | ||||
Lisa Frimston Independent |
415 | ||||
John Wesley Julian Lorenzo Gibson Christian Peoples Alliance |
166 | 5.2% |
Cuxton and Halling | |||||
Matt Fearn * Conservative |
911 | 52.1% | |||
Jacqueline Anne Cook Independent |
239 | 13.7% | |||
Katherine Mary Porter Labour |
230 | 13.2% | |||
Naomi Caroline Wilson Ukip |
191 | 10.9% | |||
Tina Munro Green party |
178 | 10.2% |
Gillingham North | |||||
Andy Stamp * Labour and Co-operative |
1,896 | 52.5% | |||
Pat Cooper * Labour and Co-operative |
1,854 | ||||
Adam Robert William Price * Labour and Co-operative |
1,702 | ||||
Robert Nigel Oakley Ukip |
613 | 17.0% | |||
Faisal Ahmed Conservative |
497 | 13.8% | |||
Kwashie Amartei Anang Conservative |
485 | ||||
Cartell Cheema Conservative |
462 | ||||
George Bernard Salomon Green party |
383 | 10.6% | |||
Sid Kingman Liberal Democrat |
221 | 6.1% | |||
Ian Rickard Liberal Democrat |
180 | ||||
Chris Sams Liberal Democrat |
152 |
Gillingham South | |||||
Naushabah Parveen Khan * Labour and Co-operative |
1,670 | 50.9% | |||
Clive Stanley William Johnson * Labour and Co-operative |
1,666 | ||||
Dan McDonald * Labour and Co-operative |
1,653 | ||||
Terry Allen Ukip |
655 | 20.0% | |||
Heidi Folk Conservative |
557 | 17.0% | |||
Les Wicks * Conservative |
553 | ||||
Harbans Singh Sidhu Conservative |
502 | ||||
Alan John Jefferies Liberal Democrat |
398 | 12.1% | |||
Geoff Juby Liberal Democrat |
387 | ||||
Nemia Juby Liberal Democrat |
324 |
Hempstead and Wigmore | |||||
Diane Margaret Chambers * Conservative |
1,641 | 67.3% | |||
Rodney Brian Chambers * Conservative |
1,613 | ||||
Raymond David John Eldridge Ukip |
325 | 13.3% | |||
Terry Reginald Lucy Liberal Democrat |
240 | 9.8% | |||
Louwella Margaret Prenter Labour |
233 | 9.6% | |||
Nabilah Khan Labour |
228 | ||||
Veronica Williams Liberal Democrat |
224 |
Lordswood and Capstone | |||||
Alan Leslie Jarrett * Conservative |
1,357 | 57.7% | |||
David Robert Wildey * Conservative |
1,189 | ||||
Jonathan Phillips Ukip |
476 | 20.2% | |||
John Gower Strevens Labour |
262 | 11.1% | |||
Simon Philip Marchant Green party |
258 | 11.0% | |||
Funmi Ayeni Labour |
248 |
Luton and Wayfield | |||||
Tristan John Osborne * Labour |
1,045 | 32.7% | |||
Joanne Christine Howcroft-Scott Labour |
1,009 | ||||
Simon Curry Labour |
1,005 | ||||
Robbie Lammas Conservative |
730 | 22.8% | |||
Alex McDermott Conservative |
693 | ||||
Keith Leslie Fletcher Ukip |
662 | 20.7% | |||
Ade Kosoko Conservative |
647 | ||||
Sam Craven * Independent |
556 | 17.4% | |||
Mike Franklin * Independent |
415 | ||||
Paul Antony O'Neill Liberal Democrat |
205 | 6.4% |
Peninsula | |||||
Ron Sands Independent |
1,413 | 31.6% | |||
Phil Filmer * Conservative |
1,157 | 25.9% | |||
Mick Pendergast * Independent |
1,125 | ||||
Roy Andrew Freshwater * Ukip |
1,002 | 22.4% | |||
Gloria Rose Thienel Conservative |
834 | ||||
Harold Ogunfemi Conservative |
792 | ||||
Julie Wallace Independent |
734 | ||||
Chris Spalding Independent |
512 | ||||
Elizabeth Castell Labour |
449 | 10.1% | |||
Sonia Lesley Hyner Green party |
446 | 10.0% | |||
Clive Bryn Gregory Green party |
442 | ||||
Joe Murray Labour |
399 | ||||
Mohammad Zubair Ahmad Green party |
371 | ||||
Simon Geoffrey Gwilym Williams Labour |
298 |
Princes Park | |||||
Tashi Bhutia * Conservative |
962 | 47.8% | |||
Gloria Blessing Chukwuka Opara * Conservative |
951 | ||||
Rav Jassal Labour |
554 | 27.5% | |||
Nicholas David Chambers Ukip |
497 | 24.7% | |||
Olu Obadare Labour |
494 |
Rainham Central | |||||
Jan Aldous * Conservative |
1,699 | 39.9% | |||
Barry Joseph Kemp * Conservative |
1,696 | ||||
Nusrat Bibi Ahmed Conservative |
1,439 | ||||
Matt Durcan Independent |
929 | 21.8% | |||
Mark John Mencattelli Independent |
670 | ||||
David James Baylis Ukip |
585 | 13.7% | |||
Mary Winifred Smith Green party |
575 | 13.5% | |||
Sajjad Ahmad Khan Labour |
475 | 11.1% | |||
Smitha Campbell Labour |
468 | ||||
Robert Alan Taylor Labour |
460 | ||||
Shanthi Ravikumar Independent |
365 | ||||
Charlie Sheregill Independent |
279 |
Rainham North | |||||
Martin Potter * Conservative |
1,633 | 64.0% | |||
Kirstine Carr Conservative |
1,580 | ||||
Chiron Peter Mottram Labour |
565 | 22.2% | |||
Benjamin Pranczke Labour |
517 | ||||
David Raymond Platt Ukip |
352 | 13.8% |
Rainham South | |||||
Gary John Hackwell Conservative |
1,565 | 39.9% | |||
Howard Francis Doe * Conservative |
1,527 | ||||
Roger Barrett Conservative |
1,388 | ||||
Jean Katherine Shirley Appleton Ukip |
682 | 17.4% | |||
Alexandra Grace Chatfield Labour |
610 | 15.5% | |||
David John Carman Labour |
601 | ||||
Tom Davis Independent |
559 | 14.2% | |||
Eddie Peake Labour |
496 | ||||
Mike Walters Liberal Democrat |
312 | 7.9% | |||
Roger James Peacock Christian Peoples Alliance |
198 | 5.0% |
River | |||||
Piers Guy Nicholas Thompson Conservative |
780 | 33.9% | |||
Habib Odunlamin Sulaiman Tejan * Conservative |
742 | ||||
Lia Helena Mandaracas Labour |
677 | 29.4% | |||
Tony John Scudder Labour |
622 | ||||
Leon Simmonds Ukip |
337 | 14.6% | |||
Caroline Mary Bowes Green party |
300 | 13.0% | |||
John Edward Castle Liberal Democrat |
207 | 9.0% | |||
Alan Edward Wells Liberal Democrat |
172 |
Rochester East | |||||
Teresa Margaret Murray * Labour |
1,332 | 48.1% | |||
Nick Bowler * Labour |
1,277 | ||||
Theresa Jane Fawcett Conservative |
542 | 19.6% | |||
Jon Lyndon Jones Conservative |
414 | ||||
Marilyn Stone Green party |
393 | 14.2% | |||
Scott Bradley Harris Ukip |
329 | 11.9% | |||
Adrian Brindley Liberal Democrat |
174 | 6.3% |
Rochester South and Horsted | |||||
Trevor Anthony Clarke * Conservative |
1,658 | 43.3% | |||
Sylvia Mary Griffin * Conservative |
1,563 | ||||
Rupert David Fearon Turpin * Conservative |
1,498 | ||||
Joe Wastell Labour |
816 | 21.3% | |||
Mark William Jones Labour |
767 | ||||
Meenatchi Gopal Labour |
766 | ||||
Rose Atkinson Ukip |
566 | 14.8% | |||
Bernard Edward Hyde Green party |
427 | 11.1% | |||
Viv Parker Liberal Democrat |
365 | 9.5% | |||
Sarah Louise Manuel Liberal Democrat |
342 | ||||
Cathy Sutton Liberal Democrat |
277 |
Rochester West | |||||
Stuart Albert Tranter * Conservative |
1,248 | 34.5% | |||
Alex Paterson * Labour |
1,126 | 31.2% | |||
Rebecca Ryan Conservative |
1,017 | ||||
Elaine Orford Thomas Labour |
775 | ||||
Catriona Margaret Jamieson Green party |
431 | 11.9% | |||
Robert Newton Ukip |
335 | 9.3% | |||
Anita Jane Holloway Liberal Democrat |
244 | 6.8% | |||
Mina Da Rui Animal Welfare party |
229 | 6.3% | |||
Peter Loftus Liberal Democrat |
166 |
Strood North | |||||
Elizabeth Jane Chitty * Conservative |
1,331 | 32.0% | |||
Stephen Alan Hubbard Labour |
1,313 | 31.6% | |||
Steve Iles * Conservative |
1,200 | ||||
James Michael Braithwaite Labour |
1,118 | ||||
Fatima Mitchell Conservative |
1,055 | ||||
Zoë Angela Van Dyke Labour |
1,037 | ||||
David John Atkinson Ukip |
604 | 14.5% | |||
Trish Marchant Green party |
499 | 12.0% | |||
Chembukkavu John George Independent |
410 | 9.9% | |||
Les Nithsdale Independent |
349 | ||||
Kevin Riches Nutter Independent |
264 |
Strood Rural | |||||
John Williams * Conservative |
1,407 | 32.4% | |||
Gary David James Etheridge * Conservative |
1,331 | ||||
Elizabeth Turpin Conservative |
1,232 | ||||
Martin Anthony Cook Ukip |
770 | 17.7% | |||
Ben Cook Independent |
724 | 16.7% | |||
Julia Cicely Hawkins Labour |
588 | 13.5% | |||
Brian Styles Independent |
538 | ||||
Charlie Matthew Curtis Kennedy Labour |
520 | ||||
Kenneth Watkins Green party |
501 | 11.5% | |||
Frank William Hurley Moreton Independent |
491 | ||||
Gareth Richard Myton Labour |
467 | ||||
Andy Millsom Liberal Democrat |
350 | 8.1% |
Strood South | |||||
Josie Iles * Conservative |
938 | 30.5% | |||
Chris Buckwell Conservative |
861 | ||||
Richard Niall Thorne Conservative |
777 | ||||
Lindsey Burke Labour |
758 | 24.7% | |||
Isaac Ikechukwu Igwe Labour |
758 | ||||
Anthony Marcus McNulty Hill Labour |
755 | ||||
Shane Karl Back Ukip |
611 | 19.9% | |||
Dave Frederick Fahey Ukip |
549 | ||||
Marja Astrid Kingma Green party |
384 | 12.5% | |||
Neil James Atkinson Independent |
382 | 12.4% | |||
Stephen McManus Independent |
269 | ||||
Alan James Tucker Independent |
216 |
Twydall | |||||
John William Lloyd Labour |
1,190 | 30.7% | |||
Hazel Louise Browne-Williams Labour |
1,139 | ||||
Mark Prenter Labour |
1,066 | ||||
Natalie Janine Jarvis Conservative |
893 | 23.1% | |||
Jim Gilbourne Conservative |
844 | ||||
Mark Paul Joy * Conservative |
819 | ||||
Rob McCulloch Martin Ukip |
645 | 16.7% | |||
Christine Barnacle Independent |
489 | 12.6% | |||
Kate Belmonte Green party |
420 | 10.8% | |||
Leona Jane McCord Independent |
300 | ||||
Maureen Ruparel Liberal Democrat |
235 | 6.1% |
Walderslade | |||||
David Frederick Brake * Conservative |
1,241 | 55.1% | |||
Adrian Victor Henry Gulvin * Conservative |
1,091 | ||||
Jonathan Brind Labour |
551 | 24.5% | |||
Robert John Heathfield Labour |
500 | ||||
Stephen Newton Ukip |
460 | 20.4% |
Watling | |||||
Wendy Purdy * Conservative |
949 | 31.5% | |||
Chrissy Stamp Labour |
928 | 30.8% | |||
Jordan Desmond Hartley Labour |
768 | ||||
Andrew William John Lawrence Conservative |
740 | ||||
Alan William Collins Liberal Democrat |
473 | 15.7% | |||
David Noel Paul Radlett Ukip |
371 | 12.3% | |||
Martin Jacob Rose Liberal Democrat |
364 | ||||
Joel Andrew Love Green party |
296 | 9.8% |
* Denotes a councillor standing for re-election
To view the full results for each , please click on the name above.
Composition of the Council
Vote Change
Swing
Previous election |
« 7 May 2015 |