Medway Council Election
3 May 2007
A full election to Medway council was held on 3 May 2007.
A total of 184 candidates stood for seven parties, while a further eight candidates stood as independents.
The Conservatives saw the size of their group increase, with a net gain of three seats. The party retained overall control of the council with 33 councillors.
Labour lost four seats, but retained their status as the official opposition on the council with 13 councillors.
The Liberal Democrats gained two seats, remaining the third largest party on the council with eight councillors.
One independent councillor was re-elected, but another lost their seat to the Conservatives.
A newly-formed independent party for Medway, the Medway Independent party, stood 17 candidates in 14 wards across Medway. Their best result in a single ward was 14.3% and none of their candidates were elected. The party did not field candidates in any election to Medway council after 2007.
Results Map
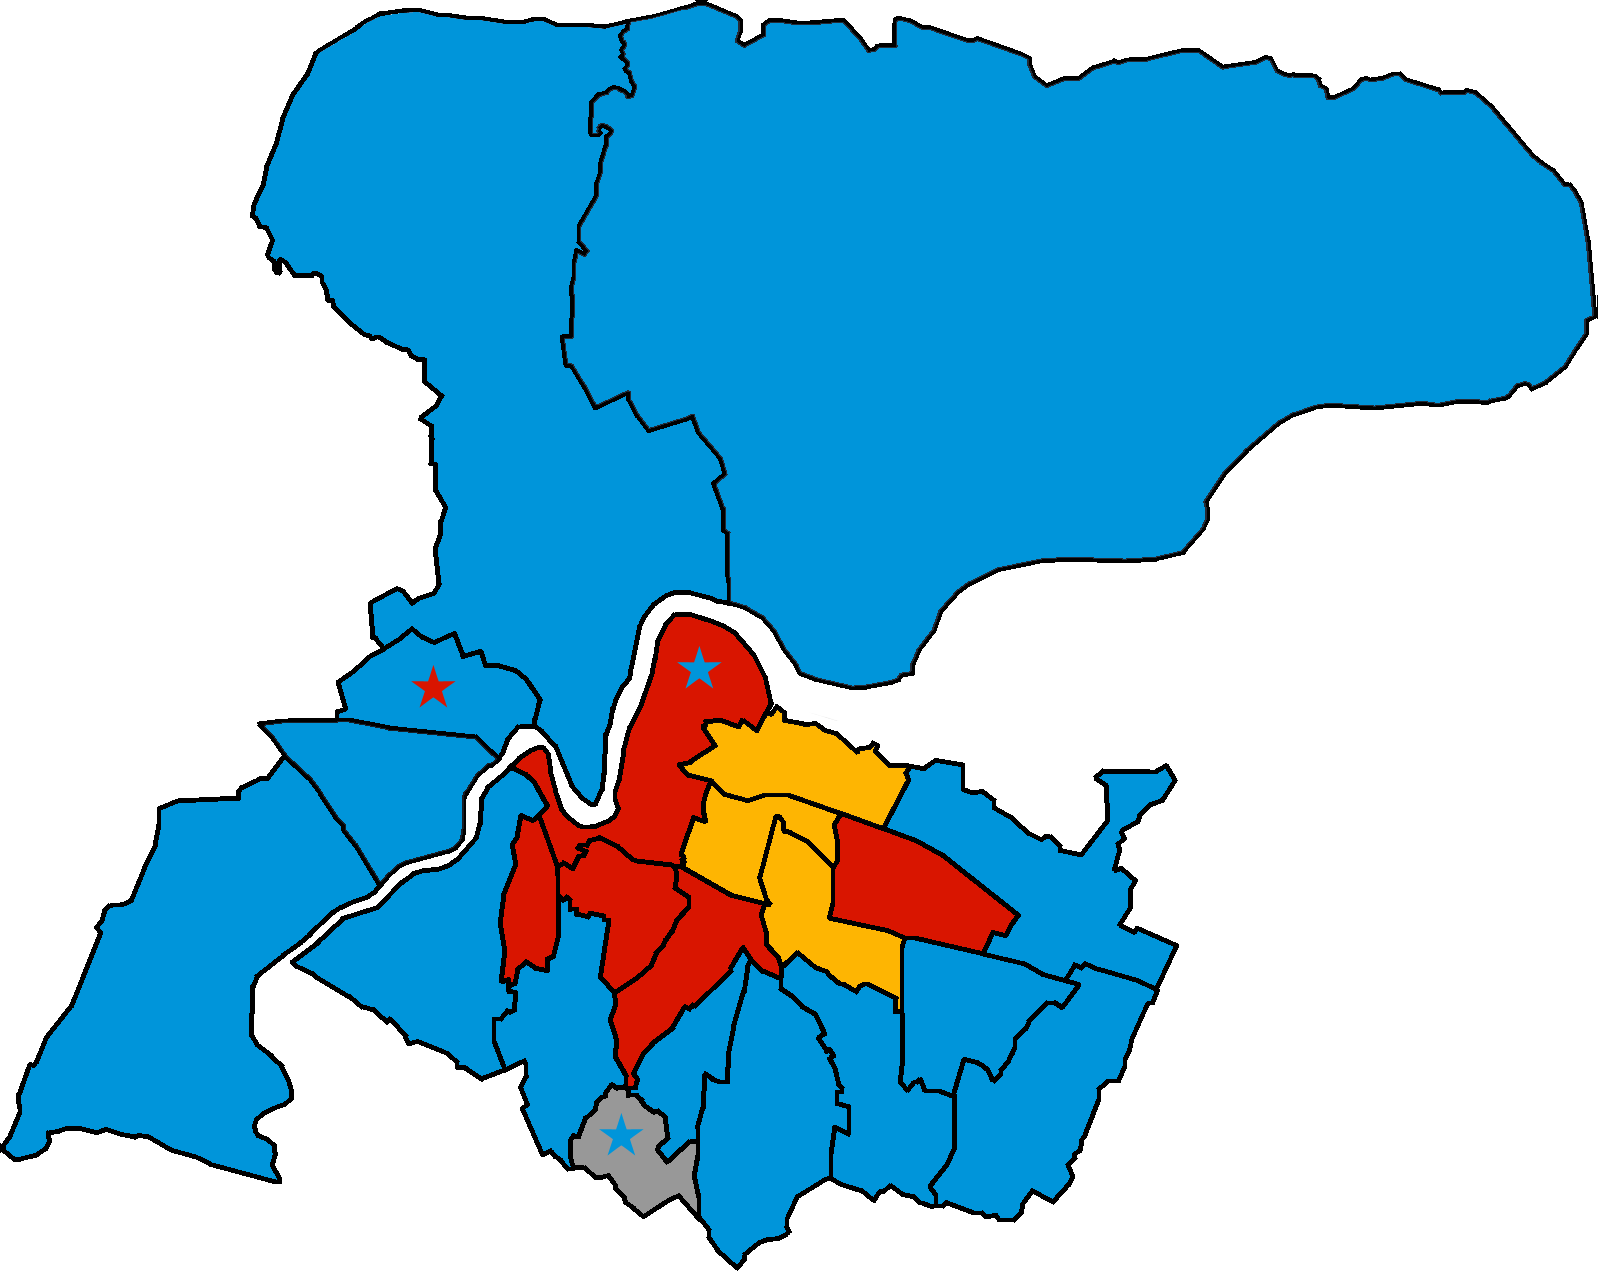
Colour denotes the highest-polling candidate in each ward. If a candidate from a different party was also elected in the same ward, they are denoted by a star.
Summary of Results
| Party | Seats | Gains | Losses | Net | Vote | Change | |
| Conservative | 33 | 5 | 2 | +3 | 38.5% | -2.8 | |
| Labour | 13 | 1 | 5 | -4 | 26.9% | -3.1 | |
| Liberal Democrats | 8 | 4 | 2 | +2 | 14.3% | -3.8 | |
| Independent | 1 | - | 1 | -1 | 7.0% | +4.3 | |
| Ukip | - | - | - | - | 6.2% | -0.3 | |
| Medway Independent party | - | - | - | - | 4.7% | +4.7 | |
| English Democrat | - | - | - | - | 1.3% | +1.3 | |
| British National party | - | - | - | - | 1.1% | -0.4 |
Click on the name of a party to view only that party's candidates.
Results by Ward
To view the full results for each ward, please click on the ward name above.
Composition of the Council
Vote Change
Swing
| Previous election | Next election |
| « 1 May 2003 | 5 May 2011 » |
Did you know? Medway Elects is an independent project with minimal advertising income and no super-rich donors. If you have found our service useful, please consider supporting us with a regular monthly donation on Patreon or buy us a coffee to help support our ongoing running costs!