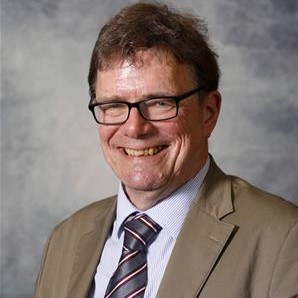
Gillingham Borough Councillors
Political Control
Between 1973 and 1979, Gillingham borough council was comprised of 35 councillors, meaning a party needed at least 18 members for an overall majority. Between 1979 and 1998, the borough elected 42 councillors, meaning a party needed at least 22 members for an overall majority.
| Control of the Council | From | To | |
| No overall control | April 1974 | May 1976 | |
| Conservative | May 1976 | May 1990 | |
| No overall control | May 1990 | May 1995 | |
| Liberal Democrats | May 1995 | March 1998 |
Leader of the Council
| Leader | From | To | |
| Unknown | Apr 1974 | May 1976 | |
| Michael Lewis | May 1976 | May 1990 | |
| Robert Sayer | May 1990 | Mar 1998 |
Conservative
All dates shown reflect unbroken terms of office as Conservative members.
Independent Liberal
All dates shown reflect unbroken terms of office as Independent Liberal members.
Labour
All dates shown reflect unbroken terms of office as Labour members.
Liberal
All dates shown reflect unbroken terms of office as Liberal members.
Liberal Democrat
All dates shown reflect unbroken terms of office as Liberal Democrat members.
SDP-Liberal Alliance
All dates shown reflect unbroken terms of office as SDP-Liberal Alliance members.

