Kent County Councillors
Political Control
Between 1974 and 1981, Kent county council was comprised of 103 councillors, 17 of which were from Medway, meaning a party needed at least 52 members for an overall majority. Between 1981 and 1998, the county elected 99 councillors, 15 of which were from Medway, meaning a party needed at least 50 members for an overall majority.
The graphic below includes all county councillors, but only members for areas now covered by Medway council are included on this website.
| Control of the Council | From | To | |
| Conservative | April 1974 | May 1993 | |
| No overall control | May 1993 | May 1997 | |
| Conservative | May 1997 | Present |
Although the borough of Gillingham and the city of Rochester-upon-Medway were removed from the control of Kent county council in 1998, the council continues to represent the rest of the county. Election results and political control of the council are not recorded on Medway Elects from 1998 onwards.
Leader of the Council
| Leader | From | To | |
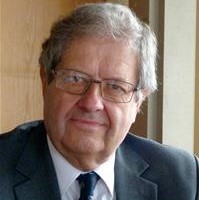
| Sir John Grugeon DL | Apr 1974 | 1982 | |
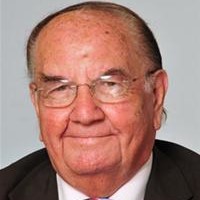
| Bobby Neame CBE DL | 1982 | 1984 | |
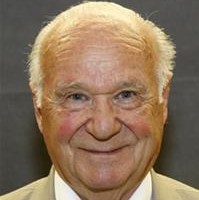
| Tony Hart CBE | 1984 | 1992 | |
| Brenda Trench | 1992 | May 1993 | |
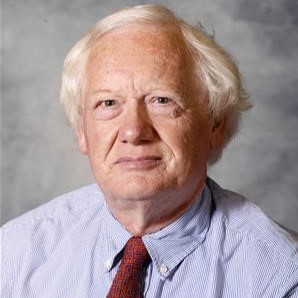
| John Ovenden | May 1993 | May 1997 | |
| The Rt Hon. Sandy Bruce-Lockhart OBE | May 1997 | Oct 2005 | |
| Sir Paul Carter CBE | Oct 2005 | Oct 2019 | |
| Roger Gough | Oct 2019 | May 2025 |
Conservative


All dates shown reflect unbroken terms of office as Conservative members for areas now covered by Medway council.
Labour

All dates shown reflect unbroken terms of office as Labour members for areas now covered by Medway council.
Liberal
All dates shown reflect unbroken terms of office as Liberal members for areas now covered by Medway council.
Liberal Democrat
All dates shown reflect unbroken terms of office as Liberal Democrat members for areas now covered by Medway council.
Did you know? Medway Elects is an independent project with minimal advertising income and no super-rich donors. If you have found our service useful, please consider supporting us with a regular monthly donation on Patreon or buy us a coffee to help support our ongoing running costs!